Data Structures
Event list
An Eventlist represents a list of photon arrival times. This object is a
ndarray subclass with the following added attributes:
tstart |
The start time of the observation |
tstop |
The stop time of the observation |
MJD |
The observation start time in MJD |
If a tstart or tstop time is not explicitly defined, the respective smallest and
largest value in the array of arrival times will be used instead. The MJD of
an Eventlist is zero unless explicitly defined.
Because an Eventlist is just an ndarray standard numpy methods can be
used to manipulate the data. Consider the following example where we generate
some random data and proceed to sort the Eventlist on time:
>>> import numpy as np
>>> import nicerlab as ni
>>> data = np.random.uniform(10,20,500)
>>> evt = ni.Eventlist(data, tstart=10, tstop=20)
>>> evt = np.sort(evt)
>>> evt.info()
Eventlist:
> counts......: 500
> exposure....: 10 seconds
> start/stop..: 10 / 20
> MJD.........: 0
Note
Event list data should generally be time ordered, however, this is not a
strict requirement for nicerlab. Data contained in an Eventlist object is
allowed to be out-of-order, and routines operating on an Eventlist will
return the correct ouput either way.
Light curve
A Lightcurve object is an array of event counts in equidistant time bins. This object is a ndarray subclass with the following added attributes:
dt |
Time bin width in seconds |
tstart |
The start time of the observation |
tstop |
The stop time of the observation |
MJD |
The observation start time in MJD |
The bin width will default to 1 if no value is provided. Like for the
Eventlist, if the tstart or tstop time is not explicitly defined,
the respective smallest and largest value in the array of arrival times will be
used instead. The MJD of an Eventlist is zero unless explicitly defined.
In addition to the extra attributes, the Lightcurve object also has special
member functions:
timespace |
Generate an array of times |
mjdspace |
Generate an array of MJD times |
A Lightcurve can be constructed manually from any iterable list of counts
as:
>>> from nicerlab.lightcurve import Lightcurve
>>> counts = [11, 12, 10, 8, 15, 12]
>>> lc = Lightcurve(counts, dt=2, tstart=0, mjd=55750)
>>> lc
Lightcurve([11, 12, 10, 8, 15, 12])
>>> lc.timespace()
array([ 0., 2., 4., 6., 8.])
>>> np.sum(lc.reshape(-1,2), axis=1)
Lightcurve([23, 18, 27])
Warning
The Lightcurve constructor will not check if the combination
dt/tstart/tstop are self consistent. The array-size/bin-width always
take precedence in determining the time axis of the light curve.
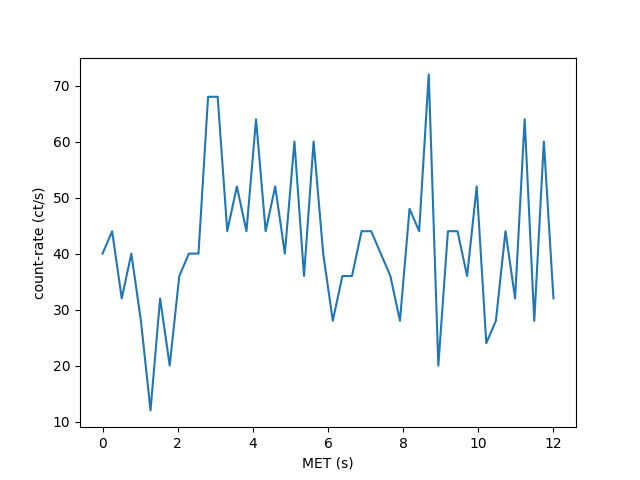
An example:
>>> import numpy as np
>>> import nicerlab as ni
>>> import matplotlib.pyplot as plt
>>> data = np.sort(np.random.uniform(0,12,500))
>>> evt = ni.Eventlist(data, tstart=0, tstop=12)
>>> lc = ni.make_light_curve(evt, dt=0.25) / 0.25
>>> plt.plot(lc.timespace(), lc);
>>> plt.xlabel('MET (s)');
>>> plt.ylabel('count-rate (ct/s)');
>>> plt.show()
Power density spectrum
A Powerspectrum object is an array of powers densities. Note that the object does not care about what normalization is used. By default the make_power_spectrum() will use the Leahy normalization. The following attributes have been added to the object
df |
Frequency bin width in Hertz |
tstart |
The start time of the observation |
tstop |
The stop time of the observation |
MJD |
The observation start time in MJD |
stack |
The number of FFT segments in the spectrum |
Additionally it has a special member function
freqspace |
Generate an array of frequencies |
Spectrum
A spectrum is an PI spectrum object.